- Return on investment – This is a simple metric that help the company to understand how much return they can expect on their investment. Simply this metrics help the company to how much return they can expect against their investment cost
Formula – Net return / Cost of investment * 100
For example –
| Cost of investment of machine | Return / production from machine | Return on investment |
| 1000000 | 200000 | 2000000 / 1000000 * 100 = 20% |
Let us take another example of imaginary person name Sonu
| Sonu investments | |||
| Business – 1 | Cost of investment – 1000000 | Return – 100000 | ROI – 10% |
| Business – 2 | Cost of investment – 1000000 | Return – 200000 | ROI – 20% |
| Business – 3 | Cost of investment – 1000000 | Return – 300000 | ROI – 30% |
| Business – 4 | Cost of investment – 1000000 | Return – 400000 | ROI – 40% |
In the above example of Sonu investment in 4 businesses in all of them business 4 is most profitable because its ROI is best in all of them, so he wants to invest more to earn larger profits from it. That how ROI works it detect and channelize funds from low return areas to high return areas to improve business profits
- Earnings per share (EPS) – This is an important metrics to evaluate a company financially. This show company earning against its outstanding shares. Simply EPS tells how much company on its per share
- Let us take a hypothetical example to understand it much better
| Rohan company LTD. | Sohan company LTD. |
| Profits for the year – 10000000 | Profits for the year – 20000000 |
| Number of shares – 1000000 | Number of shares – 4000000 |
| EPS – 10 | EPS – 5 |
Even though Sohan company LTD. earn more profits than Rohan company LTD. but Rohan company LTD. make much profit on per share that more beneficial for shareholder.
- Factors affecting earning per share

As you see in the above diagram profits / earnings is one most important factor un calculation on EPS. If you look at the above diagram, then to notice if company earning is increases it leads to higher the EPS and higher EPS better it is. Basically, EPS is considered time an important factor, so it varies year to year according company profits.

As you can see in the above diagram shares also a one of important factor in EPS. When a company as higher shares so its EPS value goes down and it has lower share its EPS value goes higher.
- How companies manipulate its EPS – Sometimes when company has low EPS its buy – back its shares so the number of shares floating in the market become less so their EPS value become higher.
- Let us take an example to understand it much better
| RAM co. LTD. | |
| Before buy – back of shares | After buy – back of shares |
| Earnings – 10000000 | Earnings – 10000000 |
| Shares – 1000000 | Shares – 500000 |
| EPS – 10 | EPS – 20 |
AS you can see in the example of RAM co. LTD. Their profits remain constant even though its EPS value will go up because they buy back its shares. So that as company manipulate its EPS by buy- back its shares so it is important to know why company EPS either go higher or lesser and it’s also important to check another metrics also to evaluate a company.
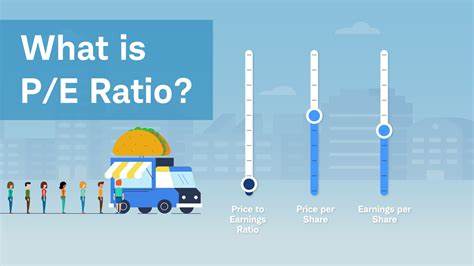
- Price to earnings ratio {P/E RATIO} – This metrics is used to evaluate a company it is important to understand that a company is either overvalued or undervalued. This tells what the EPS of a company against its market price / stock price are. Simply it is a relation between current market price of a stock and its earnings
Formula – Market price of share / EPS
Let us take example to understand it much better
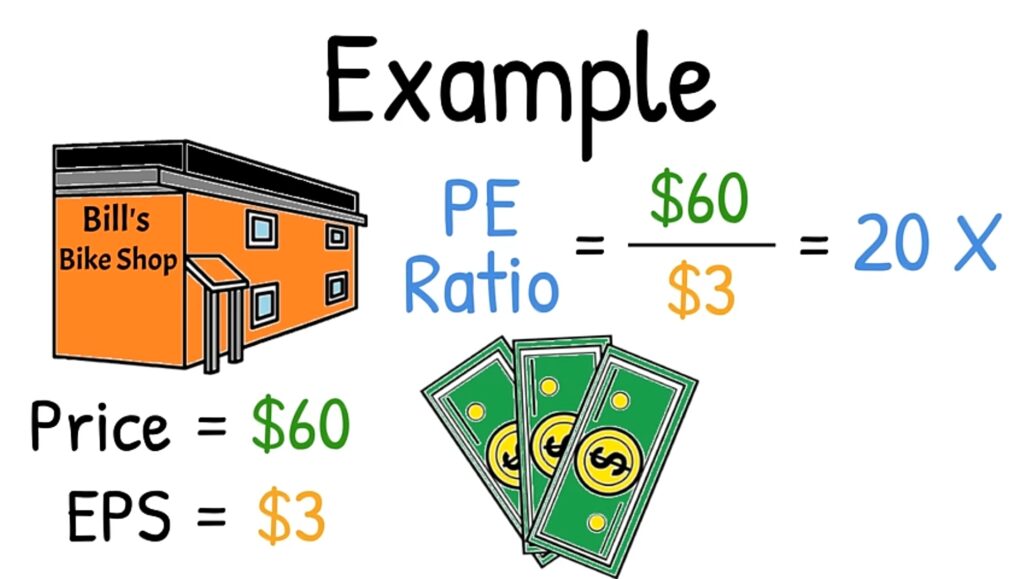
As you can see in the above example how P/E RATIO calculate price means market price of a stock.
- Relation between EPS and P/ E ratio – There is a negative relation between EPS and P/E ratio. If EPS of a company increase and its P/E ratio decrease and if EPS decrease, then its P/E ratio increases {lower the P/E is better and higher is worse}
- Let take an example to understand it much better
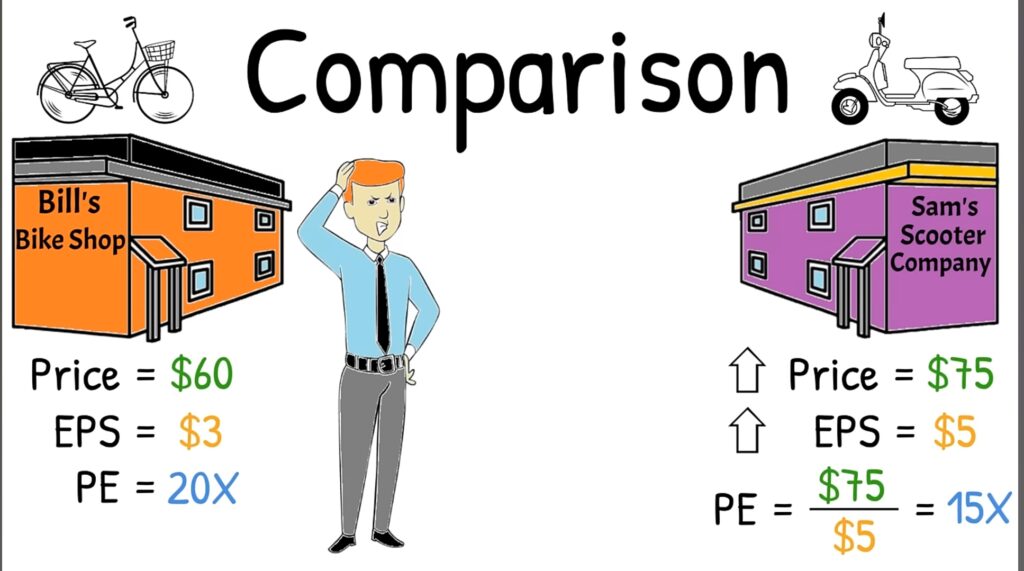
In the above diagram you can clearly see bill bike shop price of share is lesser even though Sam scooter company P/E ratio is much better because of EPS and that as how this relation works.
- Caution related to P/E ratio when it under consideration
- P/E ratio does not show the correct picture of the company for this let us take an example
| Anil CO. LTD. | Sohan CO. LTD. |
| Stock price – 100 | Stock price – 100 |
| EPS – 10 | EPS – 5 |
| P/E – 10 | P/E – 20 |
Additional information
| Anil CO. LTD. | Sohan CO. LTD. |
| Revenue 2020 -2021 – 1000000 | Revenue 2020 -2021 – 1000000 |
| Revenue 2021 -2022 – 1100000 | Revenue 2021 -2022 – 2000000 |
| Revenue 2022 -2023 – 1200000 | Revenue 2022 -2023 – 3000000 |
Even though Anil CO. LTD has a lower P/E ratio compared to Sohan CO. LTD. but if you look at their revenue then you see Anil CO. LTD. revenue grow at a lower rate so its P/E also low while on the other hand Sohan CO. LTD revenue grow at a rapid speed so even though its P/E is high today but become cheaper in future. {P/E ratio is use for future projection}
- Only same industry companies must be compared on P/E ratio because every sector has their different P/E standards. You cannot compare a service-based company with a tech company on P/E basis because both sectors have their different standards
- P/E basis Some sectors like real estate and mines and minerals company must not evaluate on P/E basis because this are very fluctuated in nature like maybe in one year, they make immense profits but not make low profits in another, so they do not evaluate on